


I apologize to all my readers for such a long lapse between posts. After a very busy summer and fall, I am back to posting regularly to my blog about PK/PD topics.
When analyzing PK/PD data, one of the most important plots used to visualize the data is to plot time-matched PK/PD data on a scatter plot. The X-axis has the PK concentration and the Y-axis has the PD data. Two examples of these scatter plots are shown below.
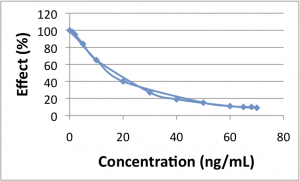
No Hysteresis
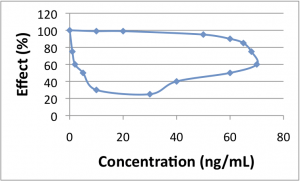
Hysteresis
The first plot shows a relationship with no hysteresis, and the second shows hysteresis. The easiest way to identify hysteresis is by drawing a vertical line on the concentration-effect plot. If that line crosses the curve in 2 places, indicating 2 different response levels for a single drug concentration, then you have hysteresis. In the first plot (no hysteresis) a vertical line at 40 ng/mL corresponds to a single effect level (20%). However, in the second plot (hysteresis) a vertical line at 40 ng/mL corresponds to both effect levels of 40% and 100%.
A hysteresis is neither good nor bad when reviewing PK/PD data. A hysteresis loop simply means that there is a time delay between the measured concentration and the effect response. Normally this means that the measured effect is indirectly affected by the measured concentration. To properly model this relationship, you would want to use an effect compartment or an indirect PK/PD model.
So a hysteresis loop simply provides information on how to model your PK/PD data.
表征化合物药代动力学(PK)和药效学(PD)的方法可能本身就很复杂和精密。PK/PD 分析是一门科学,需要数学和统计学背景以及对生物学、药理学和生理学的了解。PK/PD 分析为药物开发中的关键决策提供指导,如优化剂量、频率和暴露持续时间,因此正确做出这些决策至关重要。选择决策工具同样重要。幸运的是,PK/PD 分析软件近年来有了很大的发展,使用户可以专注于分析,而不是算法和编程语言。阅读我们的白皮书,了解选择 PK/PD 分析软件时的主要考虑因素。
