


At the request of a reader, I have decided to extend my series on bioanalysis to include another topic: calibration curves. The calibration curve is they keystone of bioanalysis. It is what links the instrument response to a specific concentration of drug. It is like the magic decoder ring that helps you decipher the hidden messages. If the ring isn’t right, then the resulting message is not interpretable (or at the least, very difficult to interpret). So, if calibration curves are so important, we should understand how they are built, and what techniques and challenges are involved.
All calibration curves are created in the same fashion. A set of samples are prepared with known amounts (and therefore concentrations) of the drug of interest. For example, you may have 12 samples between 0.1 and 1000 ng/mL. Each of these samples is processed through the bioanalytical method and the instrument response is recorded. These pairs (concentration, response) are then plotted and the relationship is evaluated. The resulting plot may look something like the hypothetical plot shown below:
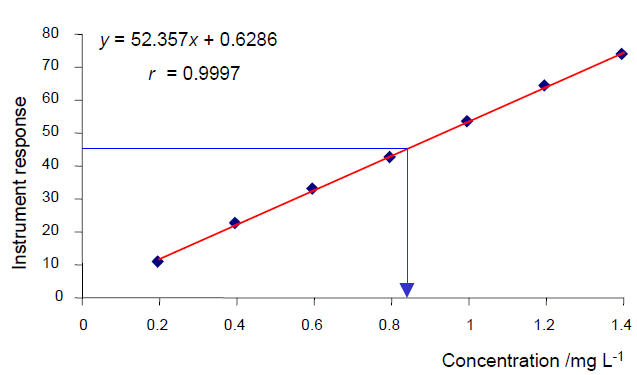
Calibration Curve
The concentrations are on the X-axis and the instrument response is on the Y-axis. The diamonds represent the observed data from the calibration runs. The red line represents a linear regression of those data points using the model y = mx + b, and the results of that regression are at the top of the plot. Finally blue line represents how the concentration is determined for a sample with unknown concentration: The instrument response is converted to a concentration using the calibration curve.
This looks easy and straightforward, so what is the challenge? The following image shows real data along with different regression models for that data (thanks to Helmut Schütz):
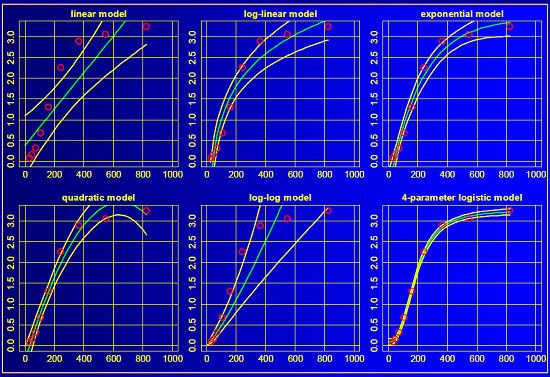
Calibration Curve 2
Each panel represents a different regression of the same data. From top to bottom and left to right, we have a linear model, a log-linear model, an exponential model, a quadratic model, a log-log model, and a 4-parameter logistic model. Which model is best? Which one should we use for determining the concentration of drug in an unknown sample?
Let’s consider each of these visually … the green lines represent the model fit, and the yellow lines represent the confidence interval around the model fit. The linear (top left) and log-log (bottom middle) models do not approximate the data very well at all. But the remaining 4 models all have reasonable fits to the data. Which one is correct? Perhaps a better question is which model will provide the best estimates of concentrations from unknown samples?
Without delving too deeply into the statistics, you can compare each model fit with the Akaike Information Criterion (AIC, link to wikipedia). The lower the AIC value, the “better” the model fits the observed data. In this specific example that Helmut presented, the 4-parameter logistic model has the lowest AIC and provides the best fit to the data. Using that model will provide the most accurate estimate of concentration based on the instrument response.
Why is all of this important? I think most pharmacokineticists don’t realize that there is uncertainty in the reported concentrations provided by bioanalytical laboratories. This is partly because bioanalysis is perceived as an “exact” science because it is measuring something quantifiable. A second reason is that pharmacokineticists often don’t realize that the reported concentrations are only estimates, based on a regression model. It may be worthwhile to review the calibration curve and the model fit generated by the bioanalytical laboratory to make sure you are comfortable with the model fit and the method used to estimate concentrations from the instrument response.
To learn more about how to systematically leverage the many benefits of M&S across a drug development program, read this white paper.
